HDSR · Fish passages
Keeping an eye on a fish passage
For HDSR, we compare water levels between basins to identify possible fish-passage blockages. Debris in the opening between two basins can block the route for fish.
Organisations involved


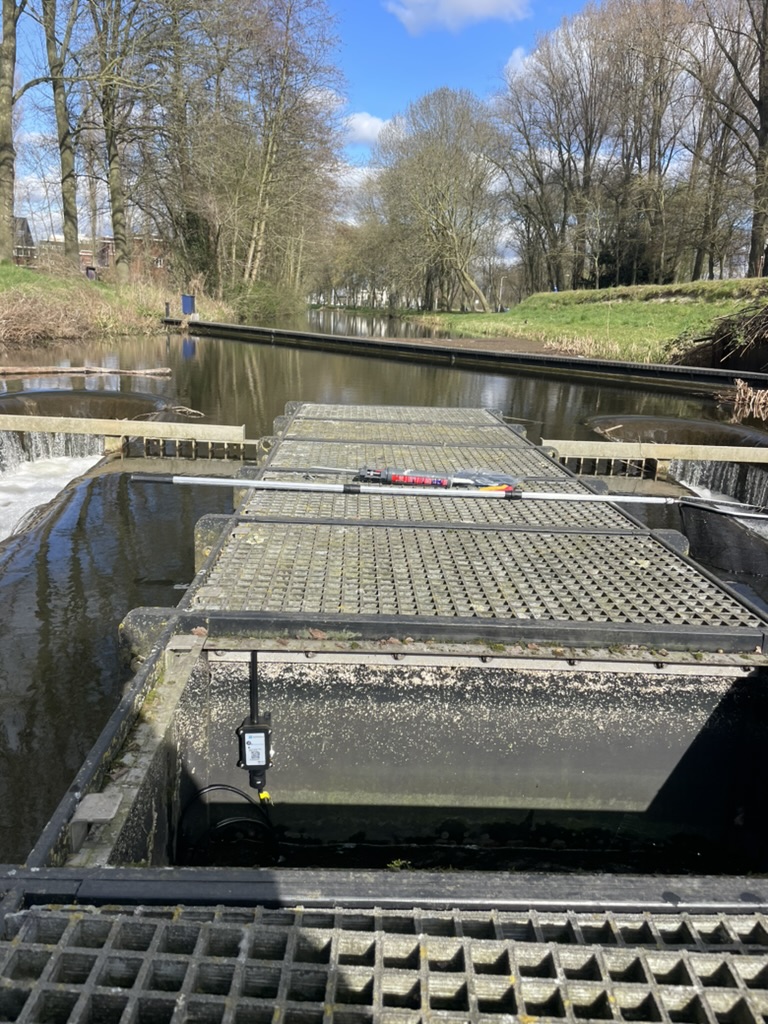
Identifying blockages between basins
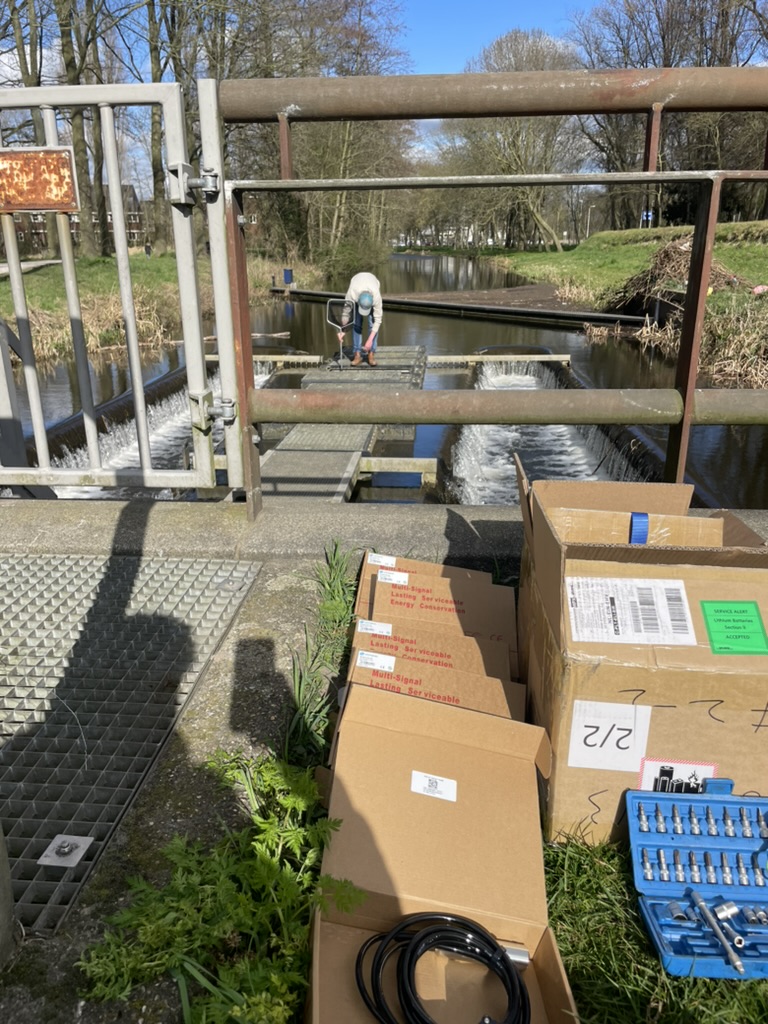
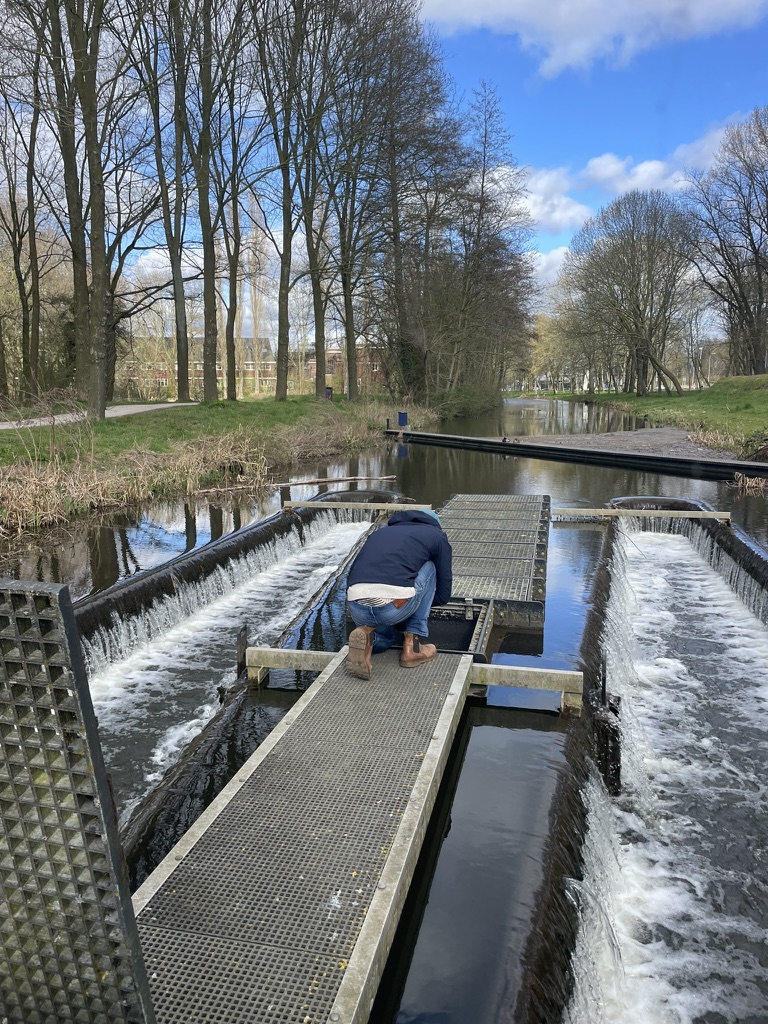
These fish passages consist of successive basins with an opening at the bottom. Debris can block that opening, preventing fish from reaching the next basin. A blockage causes the water level in that basin to rise. HDSR wanted to monitor this.
Sensor selection and water-level analysis
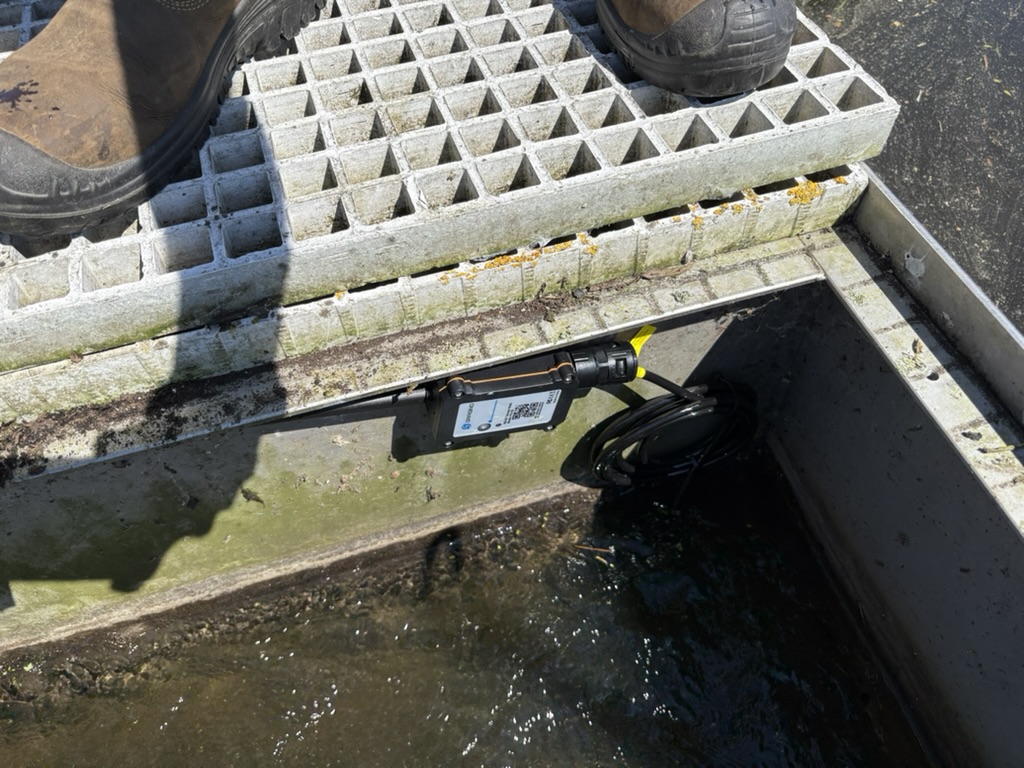
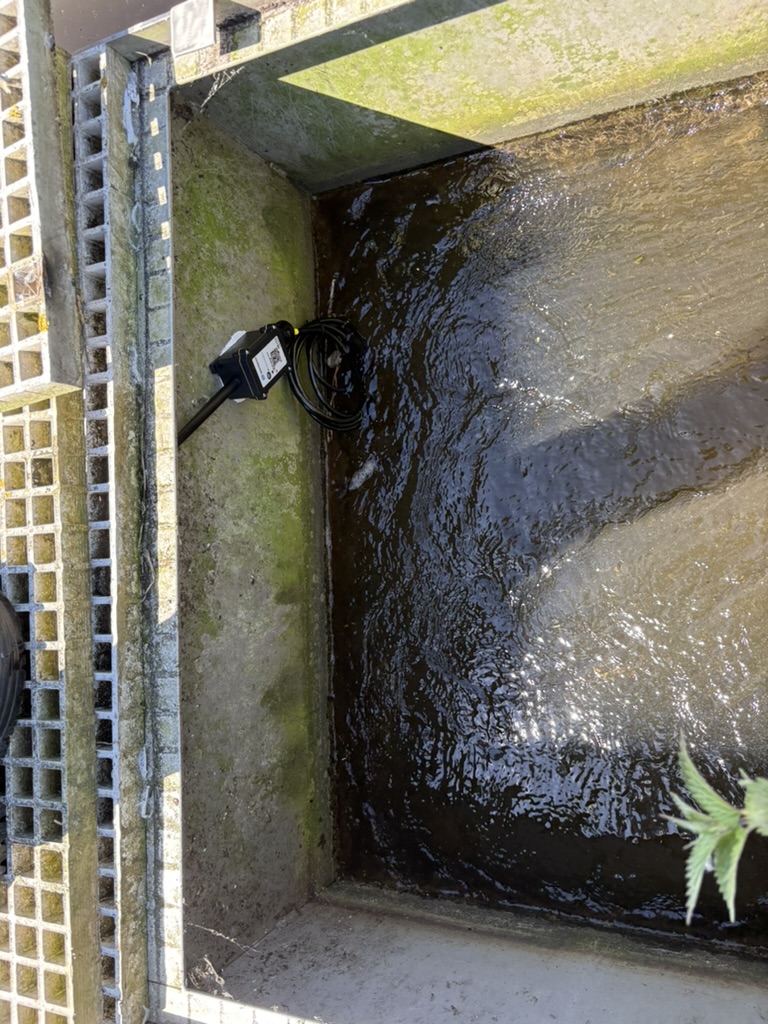
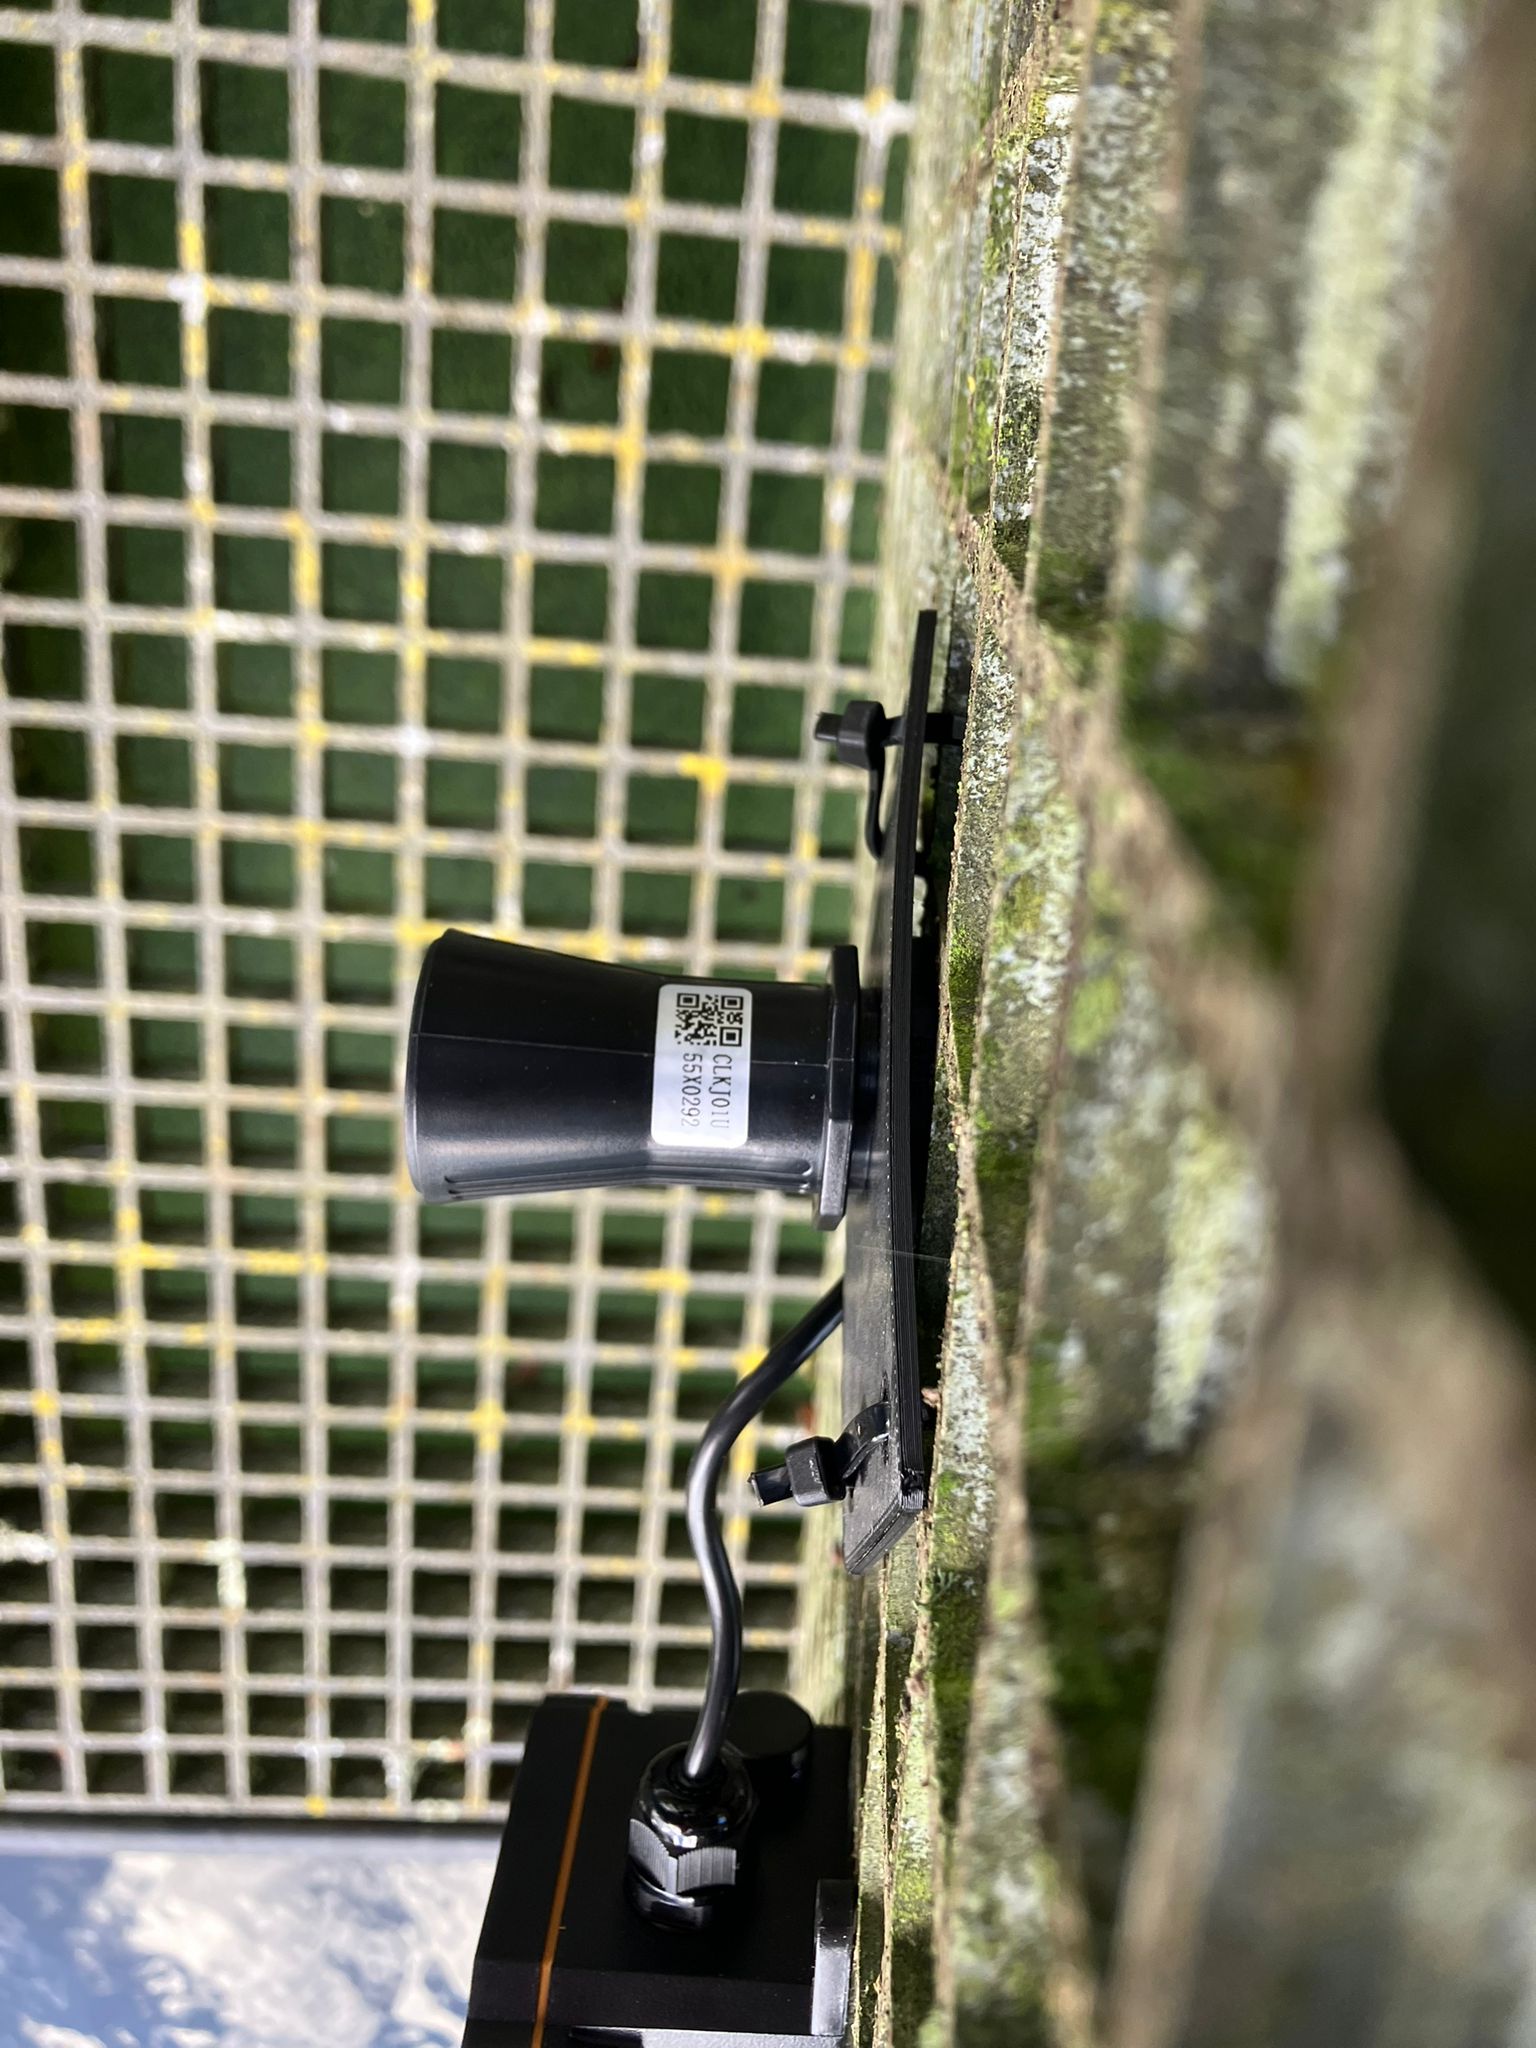
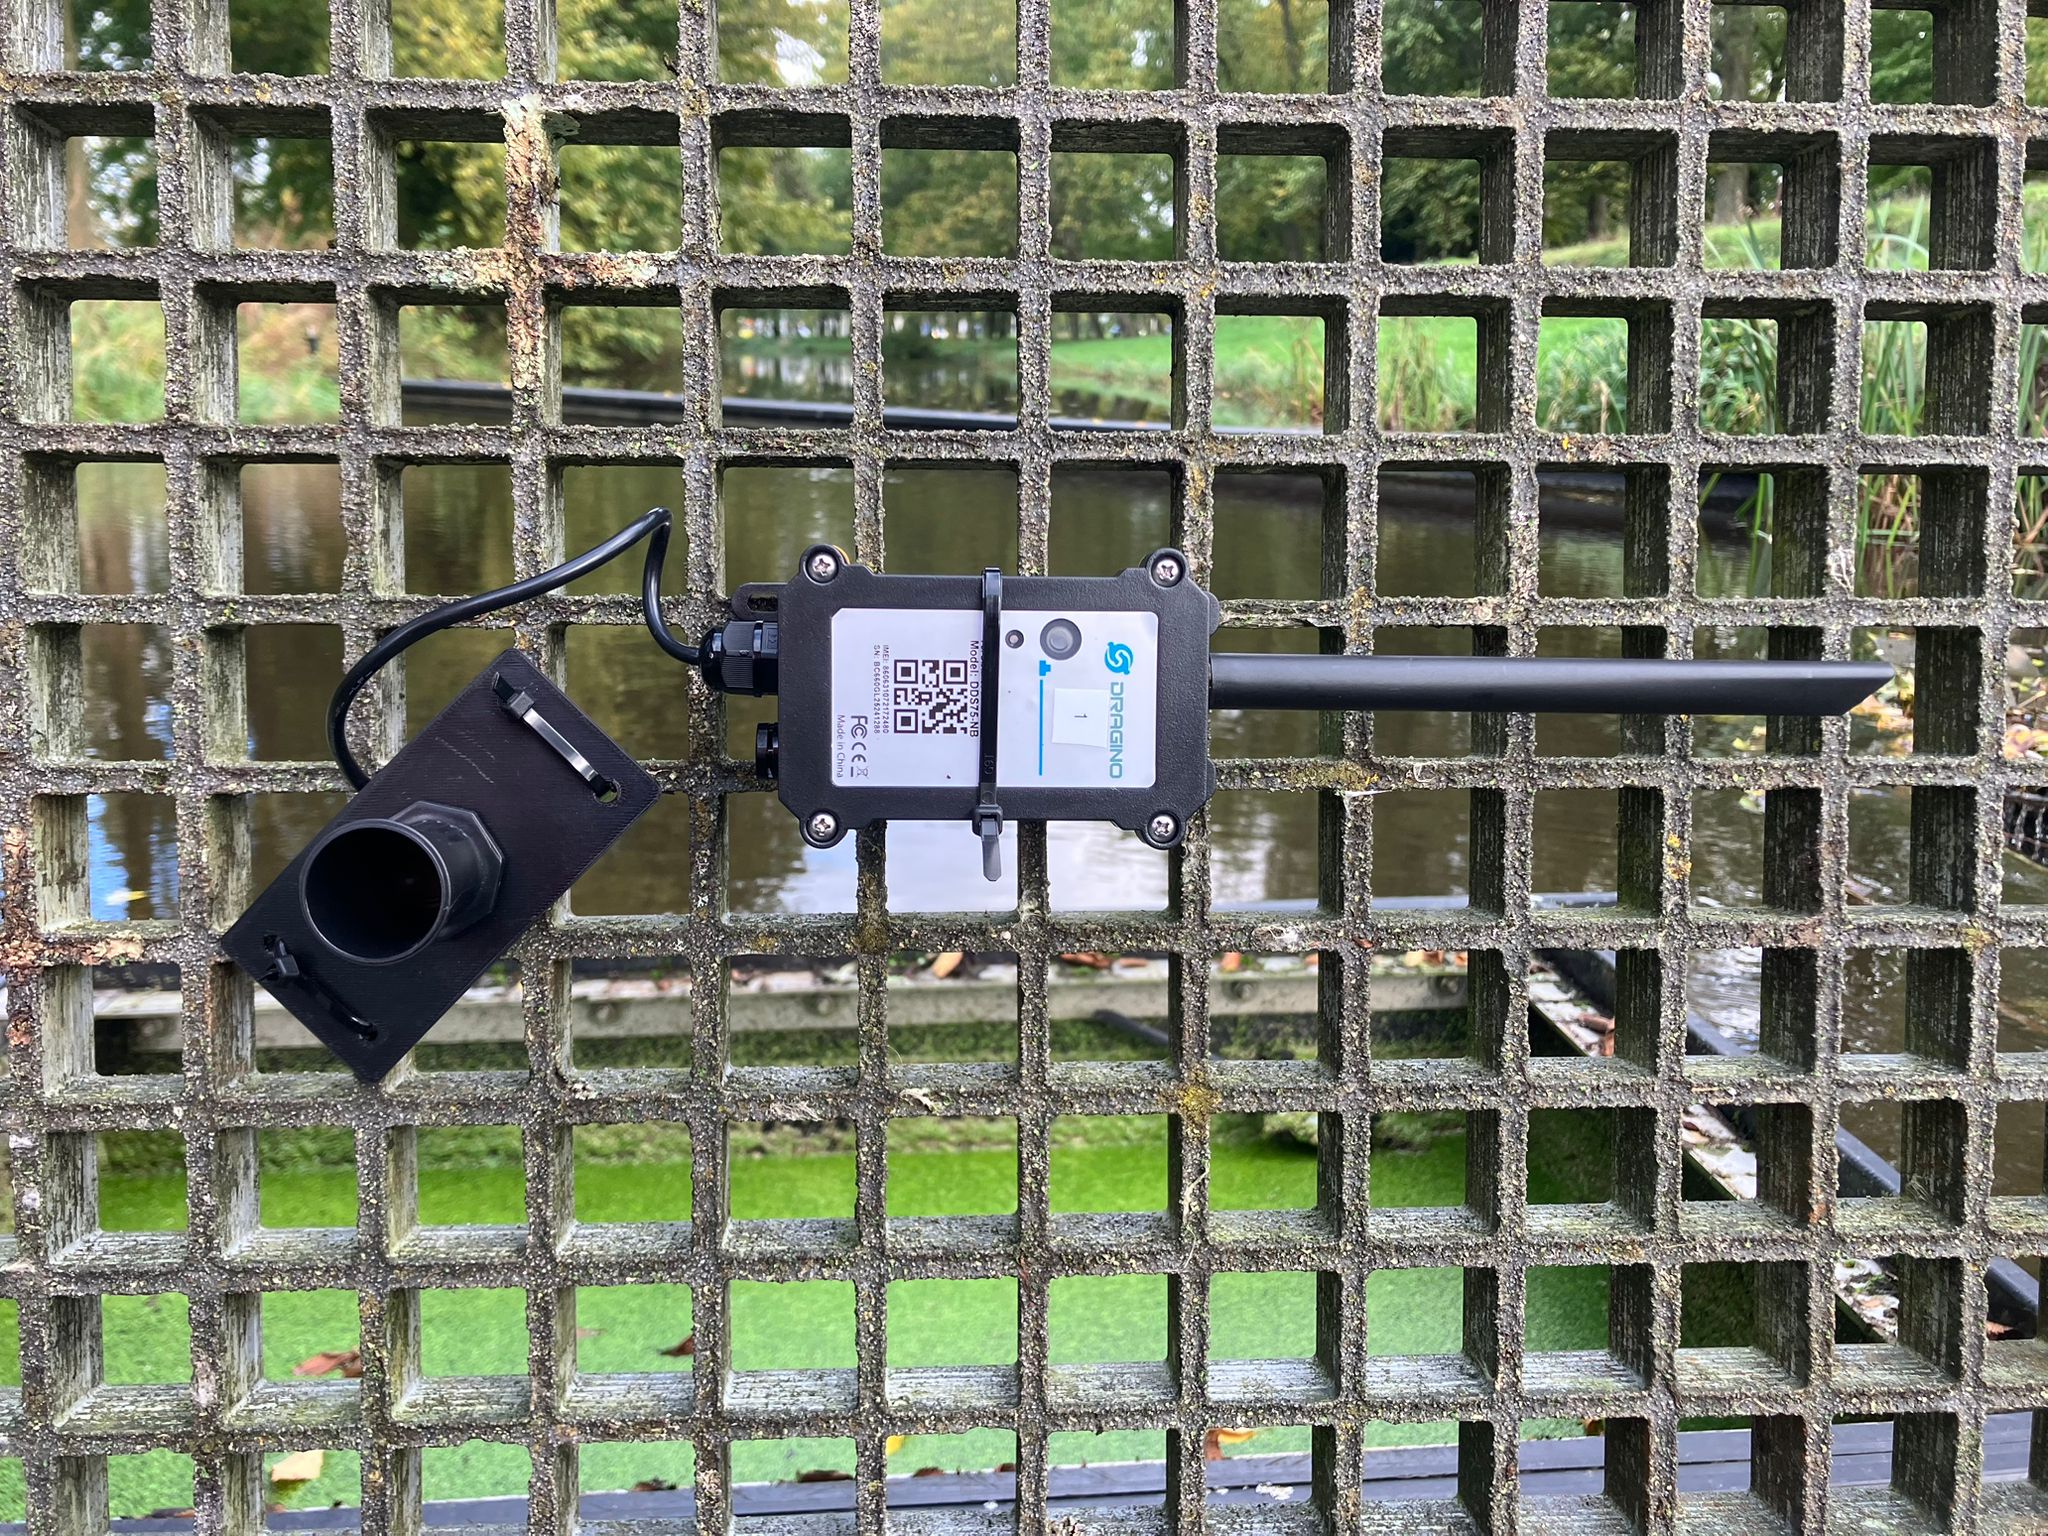
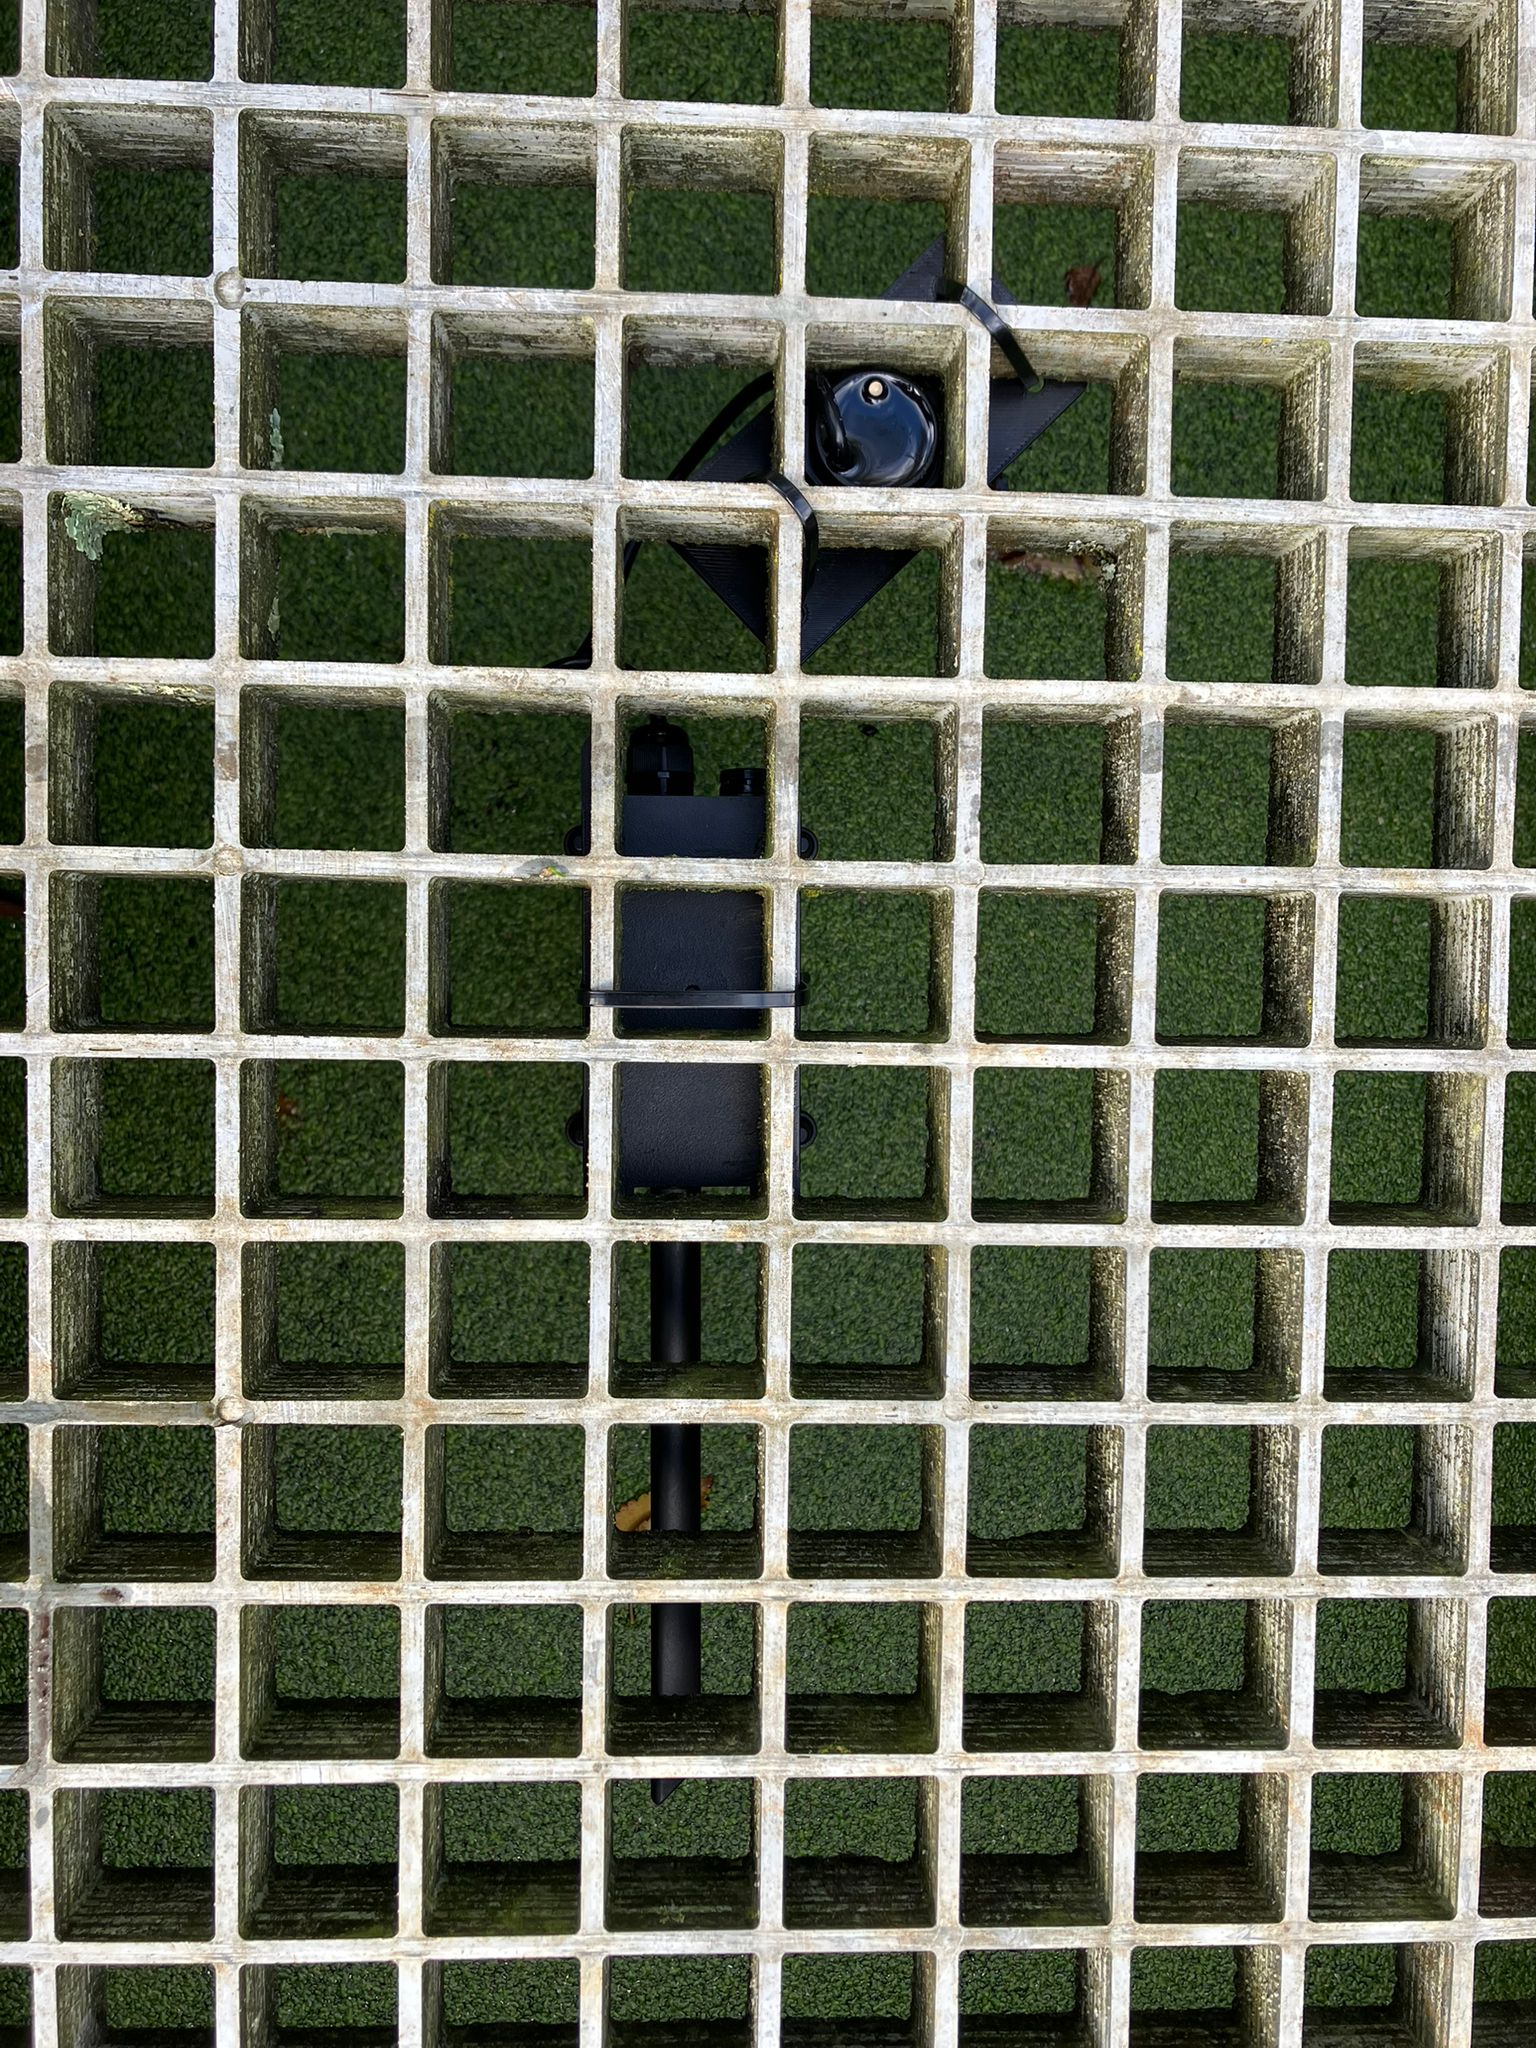
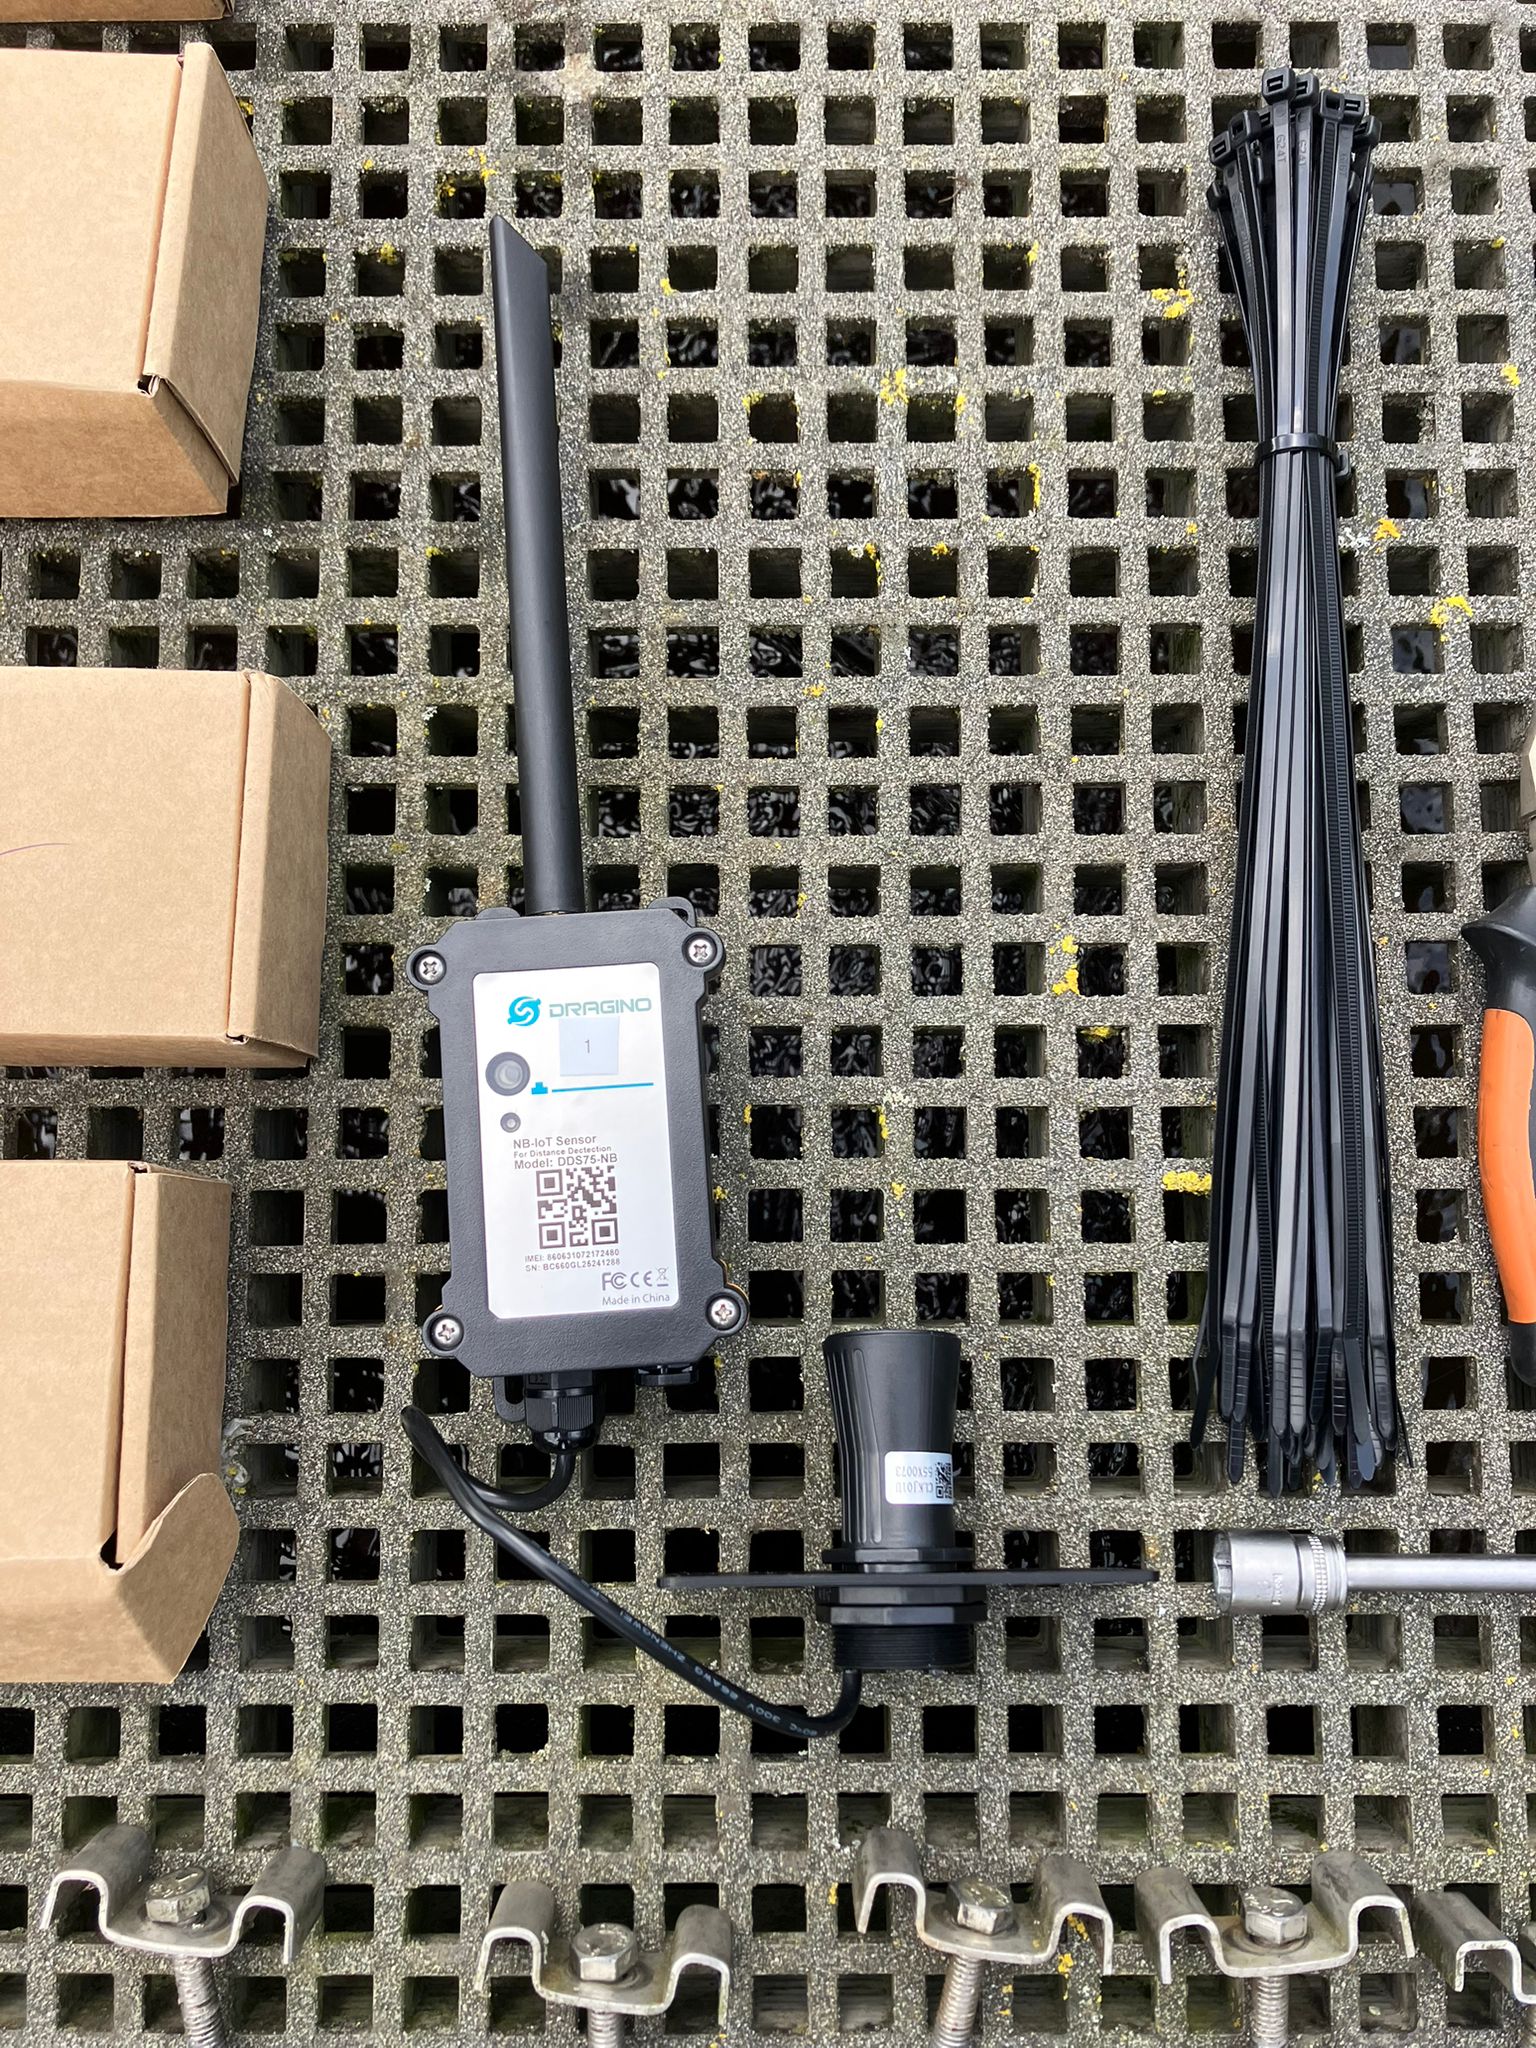
We selected the sensors and built the analysis that compares levels between basins to identify a possible blockage. We changed sensor types midway through the project. We used an ultrasonic level sensor measuring the distance to the water from above and a Dragino PS-CB immersion probe measuring through water pressure. The photos show both versions.
Continuous insight between inspections
The passages are normally inspected once or twice a year. A passage can nevertheless become blocked the day after an inspection. HDSR now has continuous water-level monitoring, making changes between periodic inspections visible.
Looking at the drop, not just the level
The water steps down through the passage, basin by basin. Each opening carries part of the total drop. When one opening becomes restricted, it takes a larger share of the drop and the other openings carry less, while the total stays about the same. We therefore compare the drop across each opening with its own normal value. That makes the analysis independent of the absolute water level, rainfall and seasonal target levels.
Results from the Zandpad passage
The fish passage at Zandpad in Utrecht has been measured continuously since March 2025. Since November 2025, seven ultrasonic sensors measure every four hours above the basins and send their readings via NB-IoT. These are the results so far.
- 27,000+
- measurements from nine basins since March 2025
- 98.7%
- of the scheduled four-hourly measurements received, Nov 2025 – Oct 2026
- 3.6 V
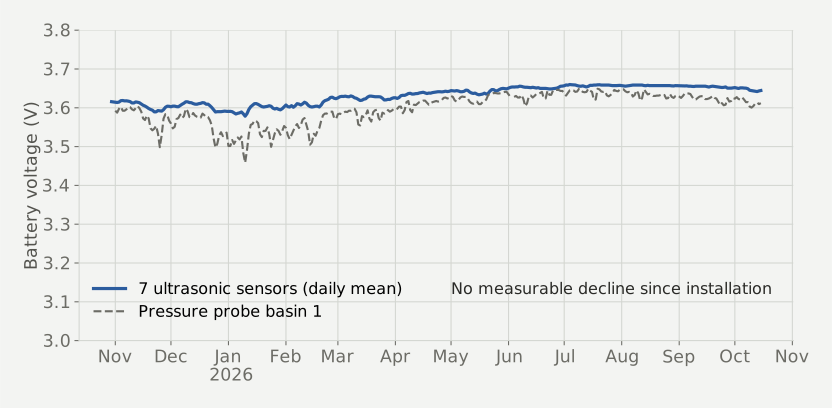
- battery voltage after eleven months: no measurable decline
- 1 day
- from the change on 10 December to a confirmed alert signal
A clear signal within a day
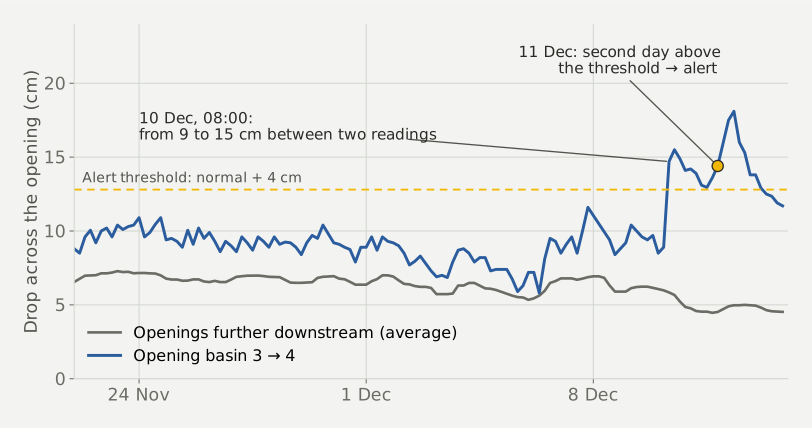
Normally the water drops about 9 cm across the opening between basins 3 and 4. On 10 December 2025, between the readings at 04:00 and 08:00, that drop jumped to 15 cm and stayed there. At the same time, the drop at the openings further downstream became smaller, because less water was getting through. That is what a partial blockage looks like. A simple rule, more than 4 cm above normal for two days in a row, would have sent an alert on 11 December. Waiting for the second day means a single odd reading never leads to an unnecessary call-out.
It also shows which opening
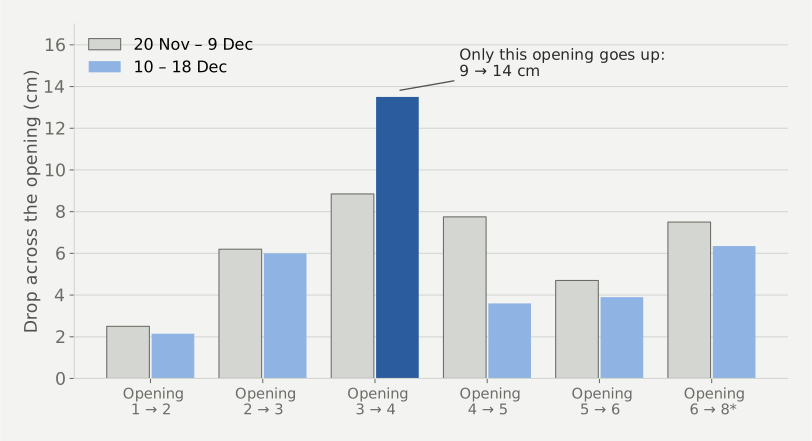
The measurements show not only that something changed, but also where. In the days after 10 December, the drop increased at one opening only: between basins 3 and 4, from 9 to 14 cm. Every other opening had the same or a smaller drop. A maintenance crew knows which opening to check before they set out.
Battery and connection
Over eleven months, 98.7% of the scheduled measurements from the seven ultrasonic sensors arrived. Their battery voltage has stayed around 3.6 V since installation. The pressure probe in basin 1, reporting since March 2025, shows the same picture.
Based on 27,076 measurements from the Zandpad fish passage in Utrecht, March 2025 to October 2026. The ultrasonic sensors measure the distance to the water; we convert this into level differences between basins. Readings below the sensor’s minimum range of 28 cm are left out.